Cohen, Peter (1989),
Cocaine use in Amsterdam in non-deviant subcultures. In: Peter Cohen (1990),
Drugs as a social construct. Dissertation. Amsterdam, Universiteit
van Amsterdam. pp. 132-147.
© Copyright 1990 Peter Cohen.
All rights reserved.
10. Effects of cocaine
Peter Cohen
- 10.1 - Introduction
- 10.2 - Prevalence of adverse effects of cocaine
- 10.3 - The effects of cocaine and their relation to level, dose and frequency of use
- 10.4 - Scales of (adverse) effects
- 10.5 - Analysis of score differences on the scales
Table of contents
10.1 Introduction
One of the uses of surveys like the present one is that insights can be gained into the distribution of effects in a relatively non-deviant sample. In this chapter we will mainly but not exclusively focus on the adverse effects of cocaine, because of their relevance for drug policy. There are many possible adverse effects of cocaine, but the probability of occurrence of each of these adverse effects is unknown. This means that asking users extensively about effects allows us to group answers as to three separate and substantial questions:
- Which of the many adverse effects mentioned in the cocaine literature occur often, less often and rarely in a relatively large group of experienced non-deviant users?
- Which of the many effects known are clearly related to level of use when they appear, and which ones can occur with any level of use?
- Which effects of cocaine have a prevalence near the 100% level, or in other words, occur with a very high probability for every user of cocaine?
As we saw in chapter 9, respondents were free to mention any advantage or disadvantage of cocaine they could think of. This resulted in a clear list of disadvantages, but even the most often mentioned disadvantage (unpleasant physical effects) was mentioned by only 57 persons of the 160 interviewed.
This was cross-checked by using three extensive check-lists of effects totaling 91 items. Two of these check-lists were taken from Morningstar and Chitwood (1983) and one was taken from Spotts and Shontz (1980). Only a small overlap occurred. Because each list was read separately to a respondent we will show the original lists separately and only rearranged according to the prevalence hierarchy per item.
In paragraph 10.2 a simple overview of prevalence is given for each item on each of the three check-lists. Paragraph 10.3 focuses on relation between the prevalence of a certain effect (in other words, the probability of occurrence of each effect) and level of use in the period of heaviest cocaine consumption. Each effect reported was crosstabulated with level of use. If probability of occurrence of a certain effect increased significantly with increased level of use (during top period), a relation between level of use and effect was established. If probability of occurrence did not change significantly that effect was not seen as level of use dependent. Since level of use is a measure that combines dose and frequency of use, we also computed simple correlations between each effect and both dose, and frequency of use.
Paragraphs 10.4 and 10.5 report our results with the construction of scales of cocaine effects. That is, we analysed which effects are closely intercorrelated, and if the variance in scale scores can be explained by our main parameters of cocaine use. This procedure did not yield one, but a few reasonably good interval scales that allow scoring. Moreover, it yielded quite a few questions about the complexity of cocaine effects.
10.2 Prevalence of adverse effects of cocaine
Our respondents were asked to report the prevalence in their career of 91 symptoms, divided into three lists. The first list contained 30 symptoms, mainly physical ones. The interviewer read each symptom from this list and asked the respondent a) if he had ever experienced this symptom, b) if he suffered it the year preceding the interview, and c) if he had experienced the symptom, did he consider it to be an effect of cocaine use.
Table 10.2.a is a list of 30 adverse effects, assembled by Morningstar and Chitwood (1983). No symptom has a zero prevalence, but five symptoms were not related by anyone to cocaine (pneumonia, diabetes, heart diseases, kidney diseases and serious accidents). The remaining 25 symptoms are all related to cocaine use by our respondents, even venereal disease and ulcers. The range is between 0.6% and 58.7%. We have to take into account that this data only reports what cocaine users subjectively consider to be symptoms related to cocaine use. The objective validity of their perceptions is unknown. These self-reports probably at least partly reflect subgroup knowledge or folklore[1](Hess, 1987).
Table 10.2.a Life time and last year prevalence of 30 symptoms (list one), and prevalence of their being reported as related to cocaine use, in % (each column N=160)
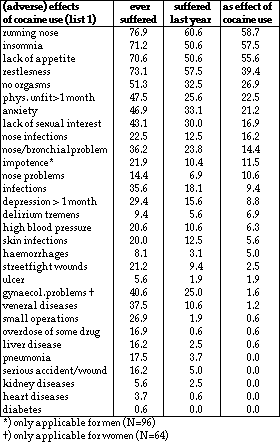
This could result in over- or underestimation, or both, and also in erroneous reports. However the subjective validity of these self-reports is beyond question and additionally interesting where a lot of intersubjectivity exists, i.e. where a high proportion of the sufferers of a certain symptom report it as an effect of cocaine.
The two striking characteristics of these data are that so many adverse effects of cocaine are reported, and that none of these effects is reported by all cocaine users.
The second list of effects was also taken from Morningstar and Chitwood (1983). Again each effect was read to the respondent who was asked to say if he had ever experienced it as a direct result of cocaine use. If so, whether this had happened between one and five times, or more than five times.
Table 10.2.b Effects of cocaine, never experienced, 1-5 times, and > 5 times (list two), in % [6]
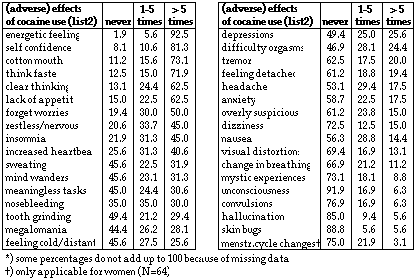
List two contains effects that seem to be more universal for cocaine users than the effects in list one. Discarding for the time being the proportions who report an effect as having occurred less than five times (to exclude possible chance effects), some effects score very highly, some even higher than identical ones in list one (like loss of appetite for food). To feel energetic is almost universal. In an open ended question, this was considered the most important advantage of cocaine by almost 69% of the respondents. The most important disadvantage mentioned in the open ended question was unpleasant physical effects, and we see many of these in the two lists.
An interesting phenomenon is that e.g. feeling cold and distant as an effect of cocaine is experienced (more than five times) by 25.6% of the respondents, but only 3.8% listed this as a disadvantage in the open ended question. We see here that replies to a structured list of effects have to be very carefully interpreted, because simple occurrence of a drug effect, be it negative or positive, does not say much about its significance for users. Or, in other words, some effects which might be looked upon as negative or adverse on paper, are not or hardly not perceived as such by users.
One of the fundamental problems of measuring drug effects with our research technique is that the absence of a control group precludes assessing the non-cocaine-related prevalence of, say, 'nose bleeding', or 'urge to carry weapons'.
Table 10.2.c Effects of cocaine, never experienced, 1-5 times, and > 5 times (list three), in % (N=160) [6]
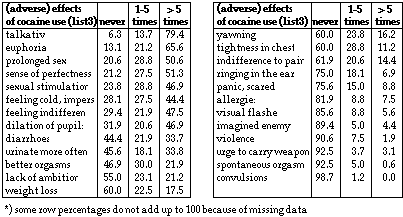
However, it is possible to find out if the small number of respondents who do report the 'urge to carry weapons' distinguish themselves on a number of general social and economic variables.
Doing this we find that the 11 respondents who report the urge to carry weapons are significantly different in their frequency of having been convicted for felony and in their frequency of having committed illegal acts (more often than ten times) for their cocaine supply. In the group of respondents that report feeling the 'urge to carry weapons' as a result of cocaine use, we find 36% who report being convicted in the last two years. In the group that does not report this urge, we find only 6% of such ex-convicts.
Moreover, the proportion of those reporting the 'urge to carry weapons' who have committed at least one illegal act in order to buy cocaine is 91%. With the non-reporters of this urge there are only 27% who have committed an illegal act to buy cocaine. This strongly suggests, that the urge to carry weapons is related to other aspects of a life style than simply the use of cocaine.
The same holds for the small group that reports seeing imaginary enemies (15 respondents). Here again there is a relationship with criminal activities. The group that reports seeing imaginary enemies contains 73% of the respondents that committed at least one criminal act in order to obtain cocaine, against 27% in the group that did not report imaginary enemies.
The group reporting an urge to show violent reactions is very similar with respect to criminal activities. In this group 66% of respondents reported at least one criminal act, versus 28% in the group not reporting 'violent' urges. Unfortunately the number of respondents that score in these three mentioned 'cocaine effects' are so small we could not include these effects in the scales (see para. 10.4).
10.3 The effects of cocaine and their relation to level, dose and frequency of use
The following paragraph will deal with the question of whether the probability of occurrence of adverse effects of cocaine increases with level of use. As was explained in chapter 3, level of use is a construct, built out of frequency of use, multiplied by dose per occasion. This means level of use consists of a certain amount of cocaine per time period (here, per week).
In this paragraph we focus only on the period of heaviest use. To find out if a certain effect is level of use related, we use information of life time prevalence of certain cocaine-related effects. If our hypothesis that certain effects are level of use-related holds, the probability that a certain effect will be reported grows if we take as a point of measurement the level of use during the period of a respondent's heaviest use.
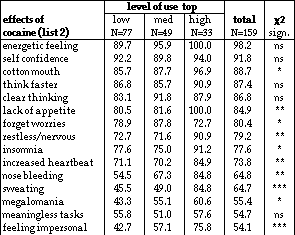
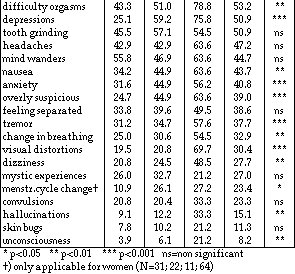
In Tables 10.3.a through 10.3.d quite a compact mass of information is conveyed. We will show the effects of cocaine use, and the percentage of respondents who report having experienced each effect (under column total). Further we show the percentages with which low users, medium users and high level users during their top period reported their experience of each effect. This way it is possible to compute if a rising level of use increases the probability of experiencing each effect.
In the following three tables, effects are hierarchically ordered according to their total prevalence.
The information from the three tables shows very clearly, that a prevalence of 100% is only reached for 2 effects, energetic feeling and lack of appetite, and then only for high level users (table 10.3.b). When we lower our threshold for 'universal' prevalence of effects to 75%, we find that medium and low level users score about the same. For these two groups we find 75% or more prevalence for 9 positive effects and 3 negative effects.
The high level users have a prevalence of 75% (and over) for 9 positive effects and 15 negative effects. For 75% of high level users we see a four to fivefold increase in negative effects. Clearly a level of use higher than 2.5 grams a week does not only pose a financial burden, it also definitively alters the balance between positive effects and negative effects. For medium and low level users the balance is overwhelmingly positive, for high level users it becomes slightly negative. When we add to this the much lower overall probabilities of other negative effects, high level users still experience these effects significantly more often than low or medium level users.
Table 10.3.a Probability of occurrence of cocaine effects (list 1), for level of use in top period and for total sample, in %
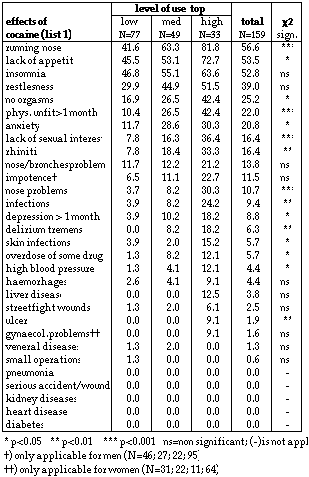
The probability that high level users stop using cocaine altogether is however no higher than with the two other groups (see par. 3.4)[2]. It would be very interesting to find out why this is so. One plausible explanation might be that the high level users in our sample almost all return to lower levels of use (see figure 3.5.a). The accumulated effects of high level use then lessen considerably as our analysis has shown. In other words, high level users have no more need to stop using in as far they return to more agreeable levels of use than users who never reached a high level. One could see here a learning effect, consisting of ways of adjusting one's level of use in order to optimise pleasure. In the words of Grinspoon and Bakalar (1984): "Most cocaine users have learned ways of taking the drug that prevent adverse effects."
Table 10.3.b Probability of occurrence of cocaine effects (list 2), per level of use in top period and for total sample, in %
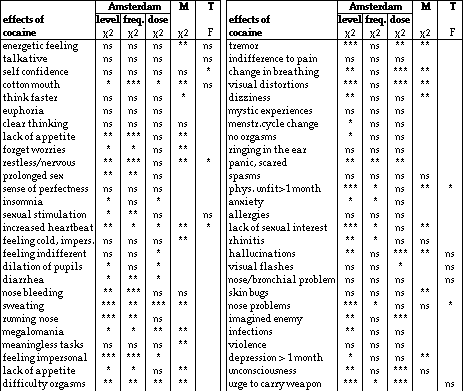
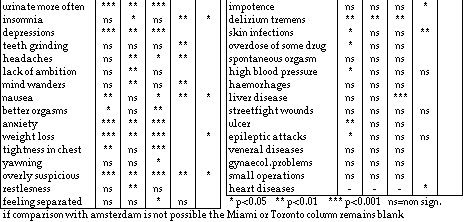
In Table 10.3.d we present an overview of all effects measured and the significance of their relation to level of use. In essence it is a compilation of the Tables 10.3.a through 10.3.c. All effects are relisted from high to low prevalence (exact prevalence measures can be found in tables 10.3.a-10.3.c). Moreover the table gives the probability of occurrence of each effect when effect is correlated with use level, dose and frequency of weekly ingestion during top period. This way it can easily be seen that the probability of occurrence of some effects changes with frequency of use (like insomnia), the probability of others change with dose (like feeling indifferent) and still others only show a change of probability of occurrence with the more complicated construct of level of use (like no orgasms). Very often combinations occur. In Table 10.3.b we see that e.g. increased heartbeat has an overall probability of occurrence of 73.8% and in Table 10.3.d that this probability significantly increases with both frequency and dose. And that, when we combine dose and frequency as level of use, the relationship between level of use and probability of occurrence of increased heartbeat becomes even stronger. But other effects, like dizziness, do not show a change of probability of occurrence with either frequency or dose, but use level (their combination) does show such a change.
Table 10.3.c Probability of occurrence of cocaine effects (list 3), per level of use in top period and for total sample, in %
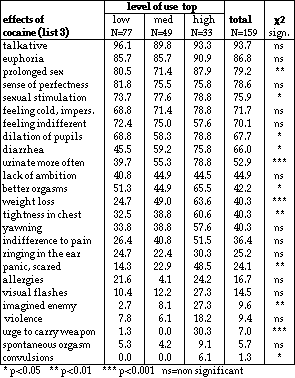
The prevalence of 21 effects is not related to use level, frequency or dose. This means that for these effects probability of their occurrence can be predicted for any user (like energetic feeling 98.2%). It also means that sometimes a very small probability exists for all users, quite independent of use level, frequency or dose of experiencing effects like haemorrhages (4.4%) or spontaneous orgasms (5.7%).
As far as possible we have included in this table comparisons with measurements of similar effects in Miami and Toronto. In Toronto effects were measured by means of unknown questions, which makes comparison tricky. In Amsterdam we used exactly the same questions for lists one and two as Morningstar and Chitwood (1983) did, so question comparability is high. However, level of use in Miami is defined in a different way, so comparability of the probability of occurrence of effects can only be made with great caution. Effects measured in Toronto have been related to frequency of use, but frequency in Toronto was measured in a different way than in Amsterdam. Consequently Table 10.3.d is not a very advanced means of comparison, although it is the best that circumstances permit.
Surprisingly we see some consistency in the data coming from the three studies in Amsterdam, Miami and Toronto. A total of 27 effects show the same tendency, being related to some parameter of use. For instance, increased heartbeat is found with 75% of all our users, in Toronto with 92% and in Miami with 88% of all users. In Table 10.3.d can be seen that in the three studies, the probability of this effect occurring rises with level of use, or with frequency, or with dose. We may cautiously conclude that occurrence of these 27 effects will be influenced by some parameter of use, and that their dose/frequency relatedness has been proven. It is also very interesting to note that this relation exists on different levels of over all prevalence. Some 14 effects are reported where no consistency exists between the three studies. For instance, the probability of occurrence of sexual stimulation by cocaine is significantly dependent on frequency of use in Amsterdam, but not related to frequency of use in Toronto. And in Amsterdam teeth grinding is reported by about 50% of the users but the probability of occurrence of this effect is not related to any parameter of use. Strangely enough this is very significantly so in Miami. We do not know exactly what accounts for these differences. It may simply be differences in measuring, or in phrasing, but also differences in user groups. When overall levels of use are greatly different between surveyed populations or when societal or cultural differences are considerable, observed relationships may be expected to differ. Because average use level and the frequency of i.v. ingestion in the Miami group is so much higher than in the Amsterdam group, it is not improbable that the relationship between parameters of use and occurrence of certain effects would differ. This is another reminder that a scientific discussion of the so called 'effects of cocaine' needs a lot more (comparable) empirical data than we have available at present.
Table 10.3.d Effects of cocaine in Amsterdam, Miami (M) and Toronto (T). For each effect is shown the significance of a statistical relation with a parameter of use
10.4 Scales of (adverse) effects
Apart from researching each possible effect and its relation to cocaine use separately, we were very curious to see if the effects were interrelated in such a way that would allow scales to be created. In this way it would be possible to reduce the number of variables from 91 (effects) to a much smaller number, and thus be able to analyse if individual scores on these scales could be explained by level of cocaine use or other variables.
With respect to this scaling procedure we split the effects in two groups: one containing the effects from list 1 (see paragraph 10.2), reported by the respondent as a result of cocaine use; and another one which contained the effects of lists 2 and 3.
For this exercise we deleted the effects with a frequency of less than ten percent, to avoid response errors.
The procedure we have used is known under the name of the scientist who developed it, Mokken, a Dutch methodologist. It is available in an extension of the well-known SPSS statistical computer program, called STAP (STatistical APpendix)[3]STAP User's Manual, Volume 4 . The Mokken-procedure is a stochastic cumulative scaling program, which can be compared with the Guttman-scale procedure, from which it differs in the fact that the scales which are the result do not necessarily have to be near-perfect cumulative scales like Guttman's.
The products of this procedure are scales of interrelated items (i.e. effects), in which the items are ordered by difficulty. Difficulty is defined as the frequency of prevalence of an item in the whole sample and so runs from 0.0 (difficult items, no response) to 1.0 (easy items, full response). We omitted the effects with a frequency less than 10%, and we did the same with effects with a frequency of more than 90%, since such an effect doesn't discriminate anymore and there wasn't a contrast group of non-cocaine users available.
The resulting scales have a coefficient of scalability (homogeneity), of H. In the Mokken scaling procedure a scale with an H-value of 0.50 or more is a strong scale, an H between 0.50 and 0.40 a medium scale and an H between 0.40 and 0.30 a weak scale. In Table 11.4.a, we present the results of our scaling procedure. In the second column are the item difficulties, in the third column the H(I) coefficients, which represent the coefficients of scalability for each Item in the scale with respect to all other items in the scale in order to judge the goodness of fit for each item separately. Scales 1 to 3 relate to the effects of list 2 and 3 (in which we defined a positive score to an item if a respondent had experienced the effect more than five times). Scales 4 and 5 relate to list 1.
Table 10.4.a Mokken scales of (adverse) effects[4]
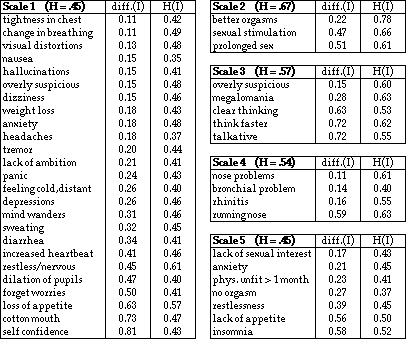
Not all effects were scalable which means that the intercorrelations of these items with the other items in the scales was too small. Beside the ones that were already deleted after our first selection (minimum item difficulty of 0.1), the following effects of lists 2 and 3 couldn't be scaled: skin bugs, visual flashes, numbness or indifference to pain, yawning, feeling separated from body, convulsions, difficult orgasms, ringing in the ear, teeth grinding, nose bleeding, meaningless tasks, urinate more often, insomnia, feeling indifferent. All the effects of list 1 with a minimum frequency could be scaled.
The creation of these relatively strong scales shows the clear correlation of effects. Effects are not isolated from each other. This makes it possible to forecast with certain probability that when a respondent experiences some so-called 'difficult' effect, he or she will also experience corresponding other, more 'easy' effects.
One of the hardest tasks connected to the development of scales is of course the interpretation of the contents of the scales. Looking at scale 1, 2 and 3, what is striking is the negative effects in the first scale and the more positive ones in the other scales. The negative effects in scale 1 are both physical and mental in nature. Some of them are clearly related together: one who loses appetite loses weight in the long run. Fear and paranoia often go together.
In scale 2 are the famous sexual arousal effects of cocaine, at least the positive ones. It is not really a surprise that these items go together. The negative side of cocaine's effect on sexuality is represented in scale 5, in which some of the negative sexual effects of cocaine use have come together, joined with other negative effects. The positive and negative sexual effects 'refused' to be put together in one scale, thus showing that non-occurrence of negative sexual effects does not predict occurrence of positive ones. [5]
Table 10.4.b Pearson correlations between scales of cocaine effects

Table 10.4.c Scores of respondents on the effect scales, mean and standard deviation


M=6.8 M=1.2 M=2.6 M=1.0
s.d.=5.7 s.d=1.1 s.d.=1.4 s.d.=1.0
Scale 3 deserves specific interest, considering the items. Following an order of growing difficulty, we see three items which in general will be thought of as positive (talkative, think faster and clear thinking), then a fourth one which is already disputable (megalomania) and a fifth one which is clearly very negative (overly suspicious). Recapturing the methodical structure of the scales, this means that those respondents who have experienced this last effect (overly suspicious) show a high probability of having experienced the other (positive effects) as well. Unfortunately we do not know if there is a clear temporal order in which respondents experience them. Our hypotheses is that with increased consumption (more frequent use, or longer lasting use occasions, or higher doses, different circumstances, etcetera) cocaine use leaves a stage in which effects are almost exclusively positive, and that new stages appear where more and sometimes even many more negative effects are experienced as well.
In Table 10.4.b we present Pearson's correlations between scales. All correlations are significant on a level of 0.003. In Table 10.4.c we present the scores of the respondents on the separate scales.
There is a rather wide variation between the respondents' scores on the scales. This will be examined in paragraph 10.5.
The highest correlation is found between scales 1 and 5, which is not surprising considering the effects they contain. As a consequence of this it was decided to exclude scale 5, the smallest one of the two, from further analysis.
10.5 Analysis of score differences on the scales
In order to find out which variables explain the variance in scores on our five scales, we applied multiple regression analysis with score values on the separate scales as dependent variables, and a range of independent variables. These independent variables were level of use during period of heaviest use (later divided into dose and frequency of use), length of cocaine using career, length of period of heaviest use [length of top period], age, gender, education and relationship with partner.
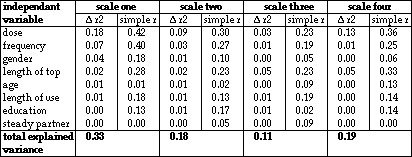
Not all of these helped explain discovered variances. Only the variables dose and frequency of use during the top period, duration of top period and gender contributed something worthwhile. In fact, most of the variances couldn't be explained at all by the variables we chose as possibly relevant. But first we will consider the results of the regression analysis for the scales one by one. See Table 10.5.a.
With respect to the first scale, the one with the long list of mostly negative effects, dose during top period contributed most to the explanation of its variance ([[Delta]]r2 = 18%). The frequency of use during top period added 7 percent on top of this and gender added an extra 4 percent (i.e. women scale higher). Together 33 percent of the variance of scale one was explained.
The other scales are all much shorter and considerably less of their variance could be explained. Of scale 2, the positive sexual scale, fourteen percent of the variance was explained by three variables (dose 9%, frequency 3% and length of top period 2%. Total: 18%). Variance of scale three, which seems to contain some generally ascribed mental effects of cocaine use, could only be explained for 11%, mostly by two variables: length of top (5%) and dose (3%). The results for scale four, which deals with nose and breathing problems, were slightly better, 19%: mainly dose during top (13%) and length of top (5%).
It is quite a surprising result that the main variables that relate to amount of cocaine used or to cocaine using career explain at most 32% of the variance found in scores on effect scales. In other words, although quite a number of the effects are related to these variables (see paragraph 10.3), they are not sufficient to explain the relationship between use of cocaine and the occurrence of a set of clearly interrelated effects. There must be other factors responsible for established variation in scores, which may be found in strictly personal characteristics of users, or in systematic settings in which cocaine is consumed (like 'lifestyles'). This means that effects ascribed to cocaine may in reality be complex results of the use of different drugs at the same time, or of the interaction between some drug use (among which cocaine) and work or social settings.
Table 10.5.a Explained variance and simple r of independent variables and scale scores [6]
Support for this hypothesis can be found in the data presented in chapter 6 where high concurrent use is shown for alcohol and tobacco, and to a lesser degree, for cannabis, and in chapter 9 where the relative importance of circumstances for perceived advantages and disadvantages of cocaine is shown.
Still another explanation, not necessarily incompatible with the latter hypothesis, could be found in the argument set forth in chapter 9. There the possibility of different types of cocaine users was presented. If each type of user could be characterized by different sensitivity to sets of effects, possibly captured by different scales, general variables relating to cocaine dose or length of user career would not be very relevant if not differentiated per user type.
Careful analysis of empirical data as presented above, especially the comparison of 'cocaine effects' measured in different investigations, and analysis of the scores on scales, has shown that the occurrence of a set of effects seems to be a very complicated matter. We will have to design cocaine research projects that will be able to deal with this complexity. Simply speaking about 'the' effects of cocaine seems to be too much of a reduction of the realities of cocaine use.
