Cohen, Peter (1989),
Cocaine use in Amsterdam in non-deviant subcultures. In: Peter Cohen (1990),
Drugs as a social construct. Dissertation. Amsterdam, Universiteit
van Amsterdam. pp. 82-100.
© Copyright 1990 Peter Cohen.
All rights reserved.
3. Level of use through time
Peter Cohen
- 3.1 - Introduction
- 3.2 - Dose: Comparison of Amsterdam, Miami and Toronto
- 3.3 - Minimum and maximum dose
- 3.4 - Frequency of ingestion
- 3.5 - Level of use
- 3.6 - Time intervals and age between stages of use
- 3.7 - Other features of use patterns
- Appendix 3 - Level of use through time for a sample of cocaine users in Miami
Table of contents
3.1 Introduction
The use of cocaine may very well be an object of scientific inquiry when a few almost obvious preconditions are met. One of these is a clear description of what is meant by 'use'.
In the following chapter the use of cocaine will be described with the help of a few simple variables. These variables are: dose, frequency of ingestion per week, route of ingestion, level of use, distribution of occasions of use during a week, and, where applicable, patterns or changes of use during the whole user career. Some methods of measuring these variables were derived from Morningstar and Chitwood (1983), in order to compare data from Miami in the early eighties with the present day situation in Amsterdam. Of course many more variables are relevant for a complete description of the 'use' of any drug. Those variables consist of personal history of drug use, period in time (compare cocaine use in 1910 vs 1980), country of use and its legal system, personality factors and setting factors. The description of use in this chapter with the help of only a few variables is based on the need for simplicity and quantification.
3.2 Dose: Comparison of Amsterdam, Miami and Toronto
We asked our respondents how much cocaine they used 'normally in a day you used coke' during three periods: the first year of regular use, the period of heaviest use and the three months preceeding the interview. Respondents could answer in grams or milligrams. If they did not know or not precisely enough, they were asked to state their consumption in 'lines' of cocaine. We followed Morningstar and Chitwood (1983) and Siegel (1985) in assuming a line of cocaine averages 25 mgs.
This latter assumption may be a little too high for Dutch circumstances, but it was impossible to let each respondent make a 'normal' line and weigh it with precision. Doing this would have made interviewing too costly. The resulting risk of overestimating dose was preferred over underestimating it. Respondents were told we translated every line into 25 mg and they were allowed to take this into consideration when estimating their dose.
Table 3.2.a Use of cocaine in mg per occasion at four measuring points, in %; mean dose per period

In Table 3.2.a we see how the average dose per occasion grows almost fourfold from initiation to period of heaviest use. But, looking at the last three months we not only see that 26.9% have stopped using, but also that respondents report an average use below the level of the first year of regular use. It would be correct however, to exclude ex-users when computing average use during the last three months. Doing so we find an average use of 188 mg with the remaining 117 users, which is almost equal to the level of the first year of regular use for the whole sample.
It is very interesting that during the top period of use over 26% of the respondents report using more than 0.5 gram per occasion, and that this dose level drops to 6.2% during the last three months. In order to interpret these data a comparison with other studies would be very useful. Unfortunately reliable comparisons are impossible because both respondent groups and ways of computing dose are neither identical nor even very similar.
However, Table 3.2.b gives a tentative background for comparison of data from three studies: Amsterdam, Toronto and Miami. It is very important to note the difficulties a comparison brings. Some of the problems are outlined.
In Amsterdam and Miami dose levels were categorized in a different way. For Miami there is only one category for 'less than 0.5 grams', versus four categories in this area for Amsterdam and Toronto. But the Miami study gives four categories for doses higher than 0.5 grams with a top category of 7 grams or more, versus one in this area for Amsterdam (> 500 mg) and two in Toronto (0.5 to 1 gr and 1 to 3 gr). The categories in the Toronto studies are given both in a gram system and in a 'lines or hits' system of use per occasion. In Toronto 44.1% of the respondents could not estimate their use in a grams system, versus only 11.7% who were unable to do so in a 'lines or hits' system. Because so many more Toronto respondents knew their quantity of use in the lines system than in the gram system we used the Toronto estimates from the 'lines' system for our comparison. We simply recomputed the data about lines consumed per occasion into mg, assuming each line to be 25 mg. This assumption cannot be validated, which is another reason for regarding the comparison with extreme caution.
For Toronto we do not know dose level during the last three months before the interview. Respondents were asked to "estimate the size of dose of cocaine typically consumed" (Erickson et al. 1987, p.70), without specifying the period.
In Miami respondents were asked to estimate used dose "on an average use day" (Morningstar and Chitwood, 1983, p.4-24), as we did in Amsterdam. This question was repeated for different periods of use (first year of regular use, period of heaviest use and last three months).
Another difference affecting comparability is method of sampling, and differences between the groups from which respondents were recruited. The Miami sample contains respondents recruited in treatment institutions and from the community versus Amsterdam's and Toronto's solely community-based samples. However, these community-based samples were not created in exactly the same ways. Further, the Miami sample was purposely made multi-ethnic, with approximately equal proportions of white, black and hispanic respondents. In Amsterdam the sample was almost exclusively white, as it was in Toronto.[1] A concept of 'normal' dose may vary considerably between different cultural or ethnic groups.
One other variable that makes comparison tricky is the quality of cocaine used. In our study we bought cocaine from respondents. This gives us at least some notion of what respondents are talking about when discussing cocaine. (70% of our cocaine samples had a cocaine hydrochloride purity of 60% and over with a high of 90.4%. See chapter 11). But we know little about cocaine quality during the user career. For Miami or Toronto no details are given at all on the quality of cocaine respondents used, so theoretically the comparisons in Table 3.2.b might concern significantly different substances. And to end this list of comparability problems, 54% of the Miami sample had used intravenously or free based either as their sole method of ingestion or as a frequent method. Both in Toronto and Amsterdam these methods were rarely found with respondents. Free basing as well as injecting usually implies higher normal doses than snorting.
Summarizing, Table 3.2.b poses comparability problems on exact dose, period of use, occasion of use, user group, methods of ingestion and purity of substance. Still, this is the nearest we can get to a comparison of the distribution of user quantities.
Table 3.2.b Tentative comparison of dose levels in Amsterdam, Toronto and Miami, (in %)
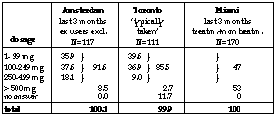
In spite of all comparability problems, the Toronto and Amsterdam samples give very similar pictures. A vast majority reported an average dose of less than 500 mg per occasion versus a small majority in Miami with an average dose over 500 mg. Very probably differences in sampling methods and -more important- recruitment populations between Miami and the other two cities are responsible for this.
3.3 Minimum and maximum dose
We will turn now to minimum and maximum doses used in Amsterdam. See Table 3.3.a and Figure 3.3.a.
Table & figure 3.3.a Minimum and maximum dose during the last four weeks, in %

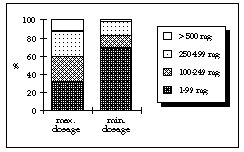
We asked our respondents to mention their maximum dose during the last four weeks and the frequency thereof. Response to this question was low, resulting in many missing values and consequently lower N values than usual in this study.
We see, that the proportion of respondents recently using half a gram or more per occasion of maximum use is small (13.2%) and that the proportion of people using more than half a gram as minimum is lower than three percent. More than half the sample did not reach 250 mg as their maximum dose per occasion during the previous four weeks.
Looking at the frequency of maximum doses during the last four weeks, we find the following. (See Figure 3.3.b)
Figure 3.3.b Number of times maximum dose is used during last four weeks (N=91)
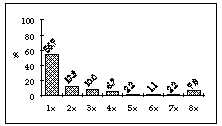
More than 50% of the respondents used their maximum dose only once during the four weeks before they were interviewed. To know whether those who have a high maximum dose use this more or less frequently than people with a lower level of maximum dose, we crosstabulated these two variables (max.dose in mg and frequency of max.dose in the four weeks prior to interview). There appears to be a positive correlation (Pearson's r=0.32, p=0.0014). This means that a higher maximum dose of cocaine is taken more often than a lower maximum dose.
We have to keep in mind however, that of the 91 persons who reported using a maximum dose during the four weeks preceeding the interview, 87% used a maximum dose below 500 mg. Only 13.3% used the maximum dose more often than four times during the previous four weeks, (none more often than eight times). So we may assume that the above mentioned correlation does not represent an indication of obsessive use.
For 34 respondents maximum dose was equal to their minimum dose, while for 33 respondents the difference between maximum and minimum ranged from 15 mg to 2000 mg. (The average difference was 157 mg.)
3.4 Frequency of ingestion
Our respondents were asked how often they would use a typical dose in their first year of regular use, their period of heaviest use and the three months preceding the interview. A card was shown to respondents with the following categories options:
- daily
- not daily but more often than once a week
- once a week
- less often than once a week, but at least once a month
- less often than once a month
Table/figure 3.4.a Frequency of ingestion of a typical dose at three temporal measuring points, in % (N=160)
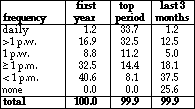
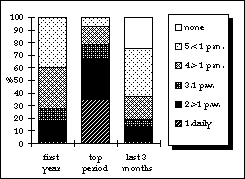
Daily use or use more than once a week shows an enormous rise from first year to top period, i.e. from 18.1% to 66.2%. In the previous three months this frequency pattern drops to 13.7%. This indicates that a large number of the experienced cocaine users have been frequent users but have apparently subsequently stopped this pattern. We will investigate possible reasons for this in chapter 9 and 10.
We will now look at frequency of use at the three temporal measuring points of four different groups. These groups are: 1) those that used at a high level during the top period; 2) those that used at a medium level during top period; 3) those that used a low level during top period; and 4) those that had stopped using. (See for a definition of each level of use paragraph 3.5.)
A few interesting aspects are revealed from tables 3.4.b, c, d and e; each of which refers to each group's period of heaviest use:
1 - There is no noteworthy difference in the propensity to stop using cocaine between the groups of low level, medium level and high level users (during period of heaviest use). Each group shows a very similar percentage of ex users, around 25%.
2 - A very marked difference can be observed regarding the probability of daily use. From 94% daily users in the high level group, via 45% daily use in the medium level group, prevalence of daily ingestion drops to 1.3% in the low level group. This difference is of course partly explained by the way 'level of use' has been computed. But it clearly shows that a daily cocaine user can be a medium level user, even (but far less probably) a low level one.
Table 3.4.b Frequency of ingestion for 'high level' users (during period of heaviest use) at three measuring points, in % (N=33)

Table 3.4.c Frequency of ingestion for 'medium level' users (during period of heaviest use) at three measuring points, in % (N=49)

Table 3.4.d Frequency of ingestion for 'low level' users (during period of heaviest use) at three measuring points, in % (N=77)

3 - Looking at frequency of ingestion during the three months
before the interview we see that high level and medium level users (during
period of heaviest use) are very similar. Both groups developed in such
a way that each shows a proportion of 'less often than once a week users'
of around 42%. Both groups also have a proportion of 'more often than
weekly' users of around 25%. The only difference between those who used
at medium and at high level during their periods of heaviest use is the
persisting of daily use. The high level group is the only one in which
a--small--proportion (6.1%) of daily users persist.
Table 3.4.e Frequency of ingestion for current non-users (during period of heaviest use) at three measuring points, in % (N=44)

4 - Of those who are abstinent during the time of the interview more than two thirds had been using more often than once a week during the period of heaviest use.This means that frequent use of cocaine during top period of use did not exclude later abstinence at all in this sample.An international comparison of frequency of cocaine use during a week is only possible for Miami and Amsterdam. The list of comparability problems that was mentioned in paragraph 3.2 is also valid here.
Table 3.4.f Frequency of cocaine use in Amsterdam in last three months (prior to interview) and in Miami in last three months (prior to treatment), in %
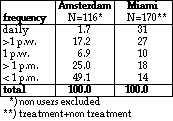
This data on frequency of cocaine ingestion is particularly relevant in the light of opinions of e.g. Nahas and Frick that 'approximately 90-95 per cent of cocaine or heroin consumers consume their drug of choice on a daily basis.' (Nahas and Frick, 1986)
Our data indicate that in Amsterdam this is only true for a minority of high level users during their period of heaviest use. It is certainly not true for the larger group of Amsterdam experienced cocaine users over a relatively long period of time. Even in a special group of American cocaine users presenting themselves for treatment, daily use occurred with 56.3% (Schnoll et al. 1985). In Chitwood's sample, in which both treatment clients and community based users were mixed, daily use occurs no more than with 31%.
3.5 Level of use
Discussing cocaine use, or that of any other drug, makes it imperative to define not only frequency of use, but also level, i.e. a combination of frequency, dose and possibly route of ingestion.
Table 3.5.a Two ways of classifying the Amsterdam sample (according to Cohen and to Chitwood) into levels of cocaine use, in %

Although Morningstar and Chitwood (1983) adopt a rather elaborate scale
for measuring level of use, Chitwood (1985) defines a low level user as
somebody who is characterized by 'primarily intranasal ingestion no more
than weekly of less than 1 gram per occasion'. This is less than one gram
per week. Medium level use is characterized by 'usually intranasal ingestion
more than weekly of more than 1 gram per occasion or intravenous ingestion
up to once a week of less than 1 gram per occasion'. For intranasal use
this is equivalent to 1- 7 grams a week for medium use. High level use
is 'primarily intravenous ingestion daily of more than 1 gram per occasion',
or more than 7 grams a week, taken intravenously. Originally we wanted
to adopt the same cut-off points between low, medium and high level use
as Chitwood did, in order to be able to make reliable comparisons. But,
the users in our sample hardly ever reached a high level as defined by
Chitwood. This was not only true for amount of cocaine consumed, but also
for route of ingestion. Free basing or i.v. cocaine use was rare. In our
sample we found an almost exclusive preference for snorting. But differentiation
in route of ingestion is an integral part of Chitwood's definition of
level of use.
Adopting the cut-off points as used in Chitwood (1985) would almost empty
our cells of high level users, irrespective of the period in the user
career[2].
See Table 3.5.a. It clearly shows that, classifying the Amsterdam sample
according to Chitwood's criteria, high level users would become extremely
rare, even during top period of use. Differences for low or medium use
are not so dramatic.
We drastically simplified our way of measuring use level as it appeared that the only discriminating variables were amount of use per occasion and frequency of ingestion per week. So, a measure for level of use was designed which included only dose and frequency. Multiplying these two variables with each other resulted in the amount of use per week, which we defined as level of use. We decided that route of ingestion be treated as a completely different variable, and not to give i.v. use a role in the definition of level of use. We also changed Chitwood's cut-off points which resulted in new categories for low, medium and high level use. Chitwood's levels of use are roughly twice to three times as high as far as amount of consumed cocaine is concerned. We defined the following levels of use:
- Low = less than 0.5 gram per week (vs Chitwood less than 1 gram per week mainly i.n.)
- Medium = between 0.5 and 2.5 gram per week (vs Chitwood 1-7 gram per week mainly i.n. or less than 1 gram per week i.v.)
- High = over 2.5 gram per week. (vs Chitwood over 7 grams a week mainly i.v.)
Table 3.5.b Levels of cocaine use over time, in % (N=160)
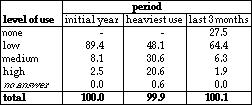
Our decision to make the cut-off point between medium and high level
use at 2.5 g per week was influenced by later informal interviews with
some respondents in our sample. We retraced some particularly experienced
users and asked them what amount per week was closest to their high level
of use. Answers were equally divided between 2 and 3 g a week, which motivated
the decision to make the cut-off point between medium and high at 2.5
g a week.
Figure 3.5.a suggests a way of showing cocaine use over time adopted from
Chitwood (1985). We have added a zero level of use (in the last three
months prior to interview) which was impossible for Chitwood because of
his intake criteria. We felt this was a serious disadvantage when showing
the dynamics of pattern evolution, so we changed our intake criteria in
such a way that we would be able to give indications of what proportion
of experienced users stop using cocaine over time.
Figure 3.5.a Levels of cocaine use over time, in % (N=158)
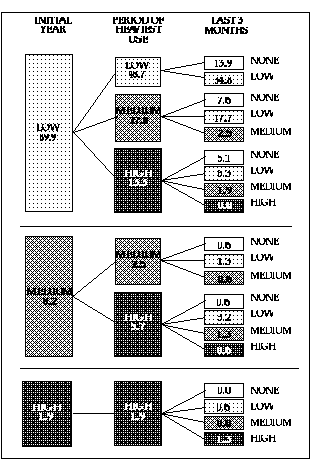
Figure 3.5.a cannot be compared to his similar figure (reproduced in Appendix 3.1) because of the sharply different cut-off points. We see in figure 3.5.a that 34.8% of the sample never exceed a low level of use. This demonstrates that it is possible for a large proportion of cocaine users to maintain a low level of use over time. If we include here the ex-users who never exceeded a low level, this proportion rises to 48.7%. Moreover of all users, 20.7% reach a high use level in the top period of their cocaine use, but only 1.9% had stayed at that level in the three months prior to interview. This means that cocaine use, defined by the differentiation within our sample, does not escalate endlessly. On the contrary, we show here empirically that people can use more than 2.5 gram per week and then evolve to non use (roughly one fifths of the high level users), to low level use (roughly half of the high level users) and to medium use (roughly one tenth of the high level users). See also Table 3.4.b.
Table 3.5.c Average length of cocaine using career by level of use index, in years (see also Figure 3.5.a)
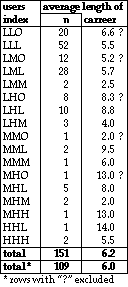
People beginning at a low or medium level had almost never progressed to use at a high level the three months prior to inverview. It could be, however, that those who never exceed a low level of use, also have a very short use career. We found that the average duration of cocaine use with those 52 respondents who never exceeded the low level, is 5.5 years, with a range of 1-15 years. See also Table 3.5.c.[3]
The 24 people who at any moment within their career used at a high level and who are still using, have an average career of 7.6 years, with a range of 1-17 years. Although careers of the latter category average more than two years longer, an average of 5.5 years for users who never exceeded the low level cannot be considered short.
In other words, we see that users who always remained at low level use are not doing so as an artefact of short careers. These data strongly suggest that the dependency-producing characteristics of cocaine may have been overstated. We also see, that frequency of use and dose per occasion vary over time, indicating that a fuller account of level of use must take this into account.
Comparing levels of use in Amsterdam, Toronto and Miami is impossible, because of the different ways 'level of use' has been computed. In Toronto, level of use is defined in term of frequency of use, life time frequency, last year frequency and last months frequency. There is no way of recomputing these data into a form that would render them comparable to the Amsterdam and Miami data. Erickson and her co-workers report about 36% frequent users, 43.2% intermediate users and 20.7% infrequent users based on lifetime, past year and past month reports. But part of the frequent users in the Toronto study (those who started in the year prior to the interview, not using more often than 25 times) would not even qualify for the Amsterdam study. This is certainly so for the 38.7% of her sample who report a life time frequency of use of less than 20 times. This means that very probably the samples in Amsterdam and Toronto are quite different in terms of the 'experience' variable.
Table 3.5.d Differences in levels of cocaine consumption in Amsterdam and Miami, in %

For a comparison with Miami it is feasible to take the distribution of level of use from two subgroups in the Miami sample: those not in treatment (last 3 months before interview), and those in treatment (last three months before entering treatment). For Amsterdam, we used level of use for the last three months prior to the interview (non users excluded). (See Table 3.5.e)
Table 3.5.e Employment status and mean income by level of use during last 3 months, in % ($ 1.00 = Ÿ 0,50)

Keeping in mind that the levels low, medium and high are meaningful within the samples, but different between samples we see that the differentiation of use levels for the non-treatment Miami respondents are very similar: large groups in the low category, and very small groups in the high category. Medium level is much higher in Miami. It is not possible to control the Miami non-treatment group for ethnicity. Therefore it is not possible to know if the distributions would be more similar if the mainly white Amsterdam sample could be compared with the white subsample of non-treatment Miami respondents.
We crosstabulated the level of cocaine use during the last three months with both the employment status, and the mean income of the respondents (see Table 3.5.d).
Very clearly the current medium users have a well above average income level, and the current non users a below average one. This suggests a correlation between current level of use and income. As will be shown in the next chapter, shortage of money is one of the most often mentioned reasons for (periodic) abstinence from cocaine use. Medium users have less frequent periodic abstinence than low or high level users (see table 4.2.b.next chapter). Income level is naturally strongly related to employment status. For some reason, the medium level group has the highest proportion of fully employed persons.
Striking is that the three respondents who are using at a high level during last three months prior to interview, are all unemployed. Further analysis shows that they were unemployed for more than 18 months. Their normal profession is unknown. One of them had been convicted for a felony in the previous two years. However, their number is too small to even speculate about the relation between their employment status and level of use during the three months before the interview.
3.6 Time intervals and age between stages of use
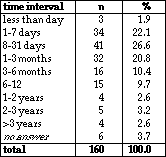
For almost three-quarters of our respondents, it took 3 months or less to try cocaine for the second time after initiation. Half of our respondents used cocaine for the second time within one month, most of the other half within a year.
Table 3.6.a Time interval between initiation and second use of cocaine
Very interesting are the time intervals between initiation, first year
of regular use, and first year of heaviest use. (Table 3.6.b.) We see
that more than half of our sample started using cocaine regularly within
two years after initiation, and that most reach their period of heaviest
use within three years (77%). Curiously, these periods do not (partly)
overlap. On average it takes users even 2.2 years before they start using
regularly, from there to top period a further 1.9 years, while the average
period between initiation and top period appears to be 4.2 years. Of course
these are only averages, for individual users these time intervals may
very well coincide.
The age distribution for first regular use and for top period is shown
in Table 3.6.c.
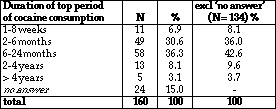
The duration of the top period of cocaine consumption is known of 136 respondents, and shown in Table 3.6.d.
Table 3.6.b Time interval between initiation and the first year of regular use, and time interval between first year of regular use and first year of heaviest use, in % (N=160)
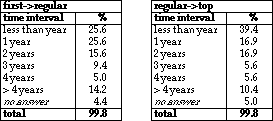
Table 3.6.c Age at two stages in cocaine using career

A top period duration of over 2 years is rare. For the over 44% of the
respondents for whom duration of top period is known, it does not last
longer than 6 months. Average duration is 22 months. Data like this are
especially interesting in rethinking the concept of dependence on cocaine.
Duration of top period shows a small but significant correlation with
level of use (Pearson's r=0.28, a<0.01). A higher use level during
top period makes a longer top period somewhat more probable. It is presently
not understood why this is so. It would be extremely interesting to find
out how and in what circumstances a level of use establishes and maintains
itself. Looking at the often mentioned conditions in which cocaine use
is reported to fit (see chapter 8: Set and Settings of cocaine use) it
would not be surprising if having many friends in an actively socializing
circle combined with an above average income would both prolong and increase
levels of use.
Table 3.6.d Duration of top period of cocaine consumption
3.7 Other features of use patterns
Our respondents were asked a few questions, taken from Morningstar and Chitwood's questionnaire, about use patterns. These questions related to development of use over time, partitioning of a typical week during the last month in use and non use days, and speed of use at a typical occasion of cocaine consumption.
The development of use over time was symbolized as simple graphic shapes, clarified by a short text. A card showing Figure 3.7.a was shown to the respondents.
Figure 3.7.a Theoretical patterns of development in cocaine use
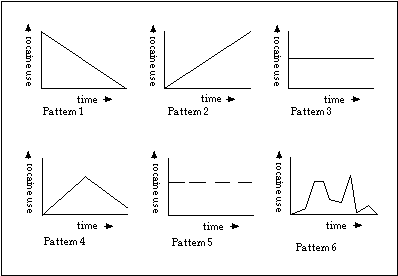
The distribution of these different modes of development of use is shown in Table 3.7.a. The most interesting detail of this distribution is not that apparently many modes of development can exist, but that a mode associated to dependency production (slowly more: pattern 2) is reported by only 3.1% of our respondents.These data are consistent with the findings that indicate a relatively short duration of the top period of consumption.
Clearly the current users have a preference for weekend use, which corresponds with the dominant answers about social situations in which cocaine use is seen as functional. (See Chapter 8: Set and setting of cocaine use.)
Table 3.7.a Frequency of development patterns
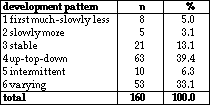
This table shows that a way of use associated with a strong probability of occurrence of negative side effects (binge use) is practised by a small minority of users. Binge use is described as 'a continuous period of repeated dosing, usually at least once every 15 to 30 minutes, during which users consume substantial amounts of cocaine. During binges users may assume some of the behavioural characteristics of compulsive users' (Siegel 1985, p.210) Siegel found between 1970 and 1978 17% of his respondents to binge, which approximates the proportion (13.8%) we found.
Table 3.7.b Partitioning of week (during last four weeks) in days of use
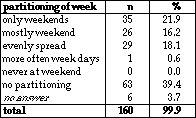
Table 3.7.c Speed of use at a typical occasion

Appendix 3 -
Level of use through time for a sample of cocaine users in Miami
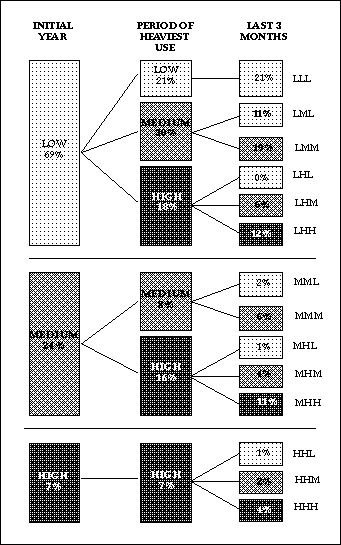
Source: Chitwood (1985)
